


The Built Different Index: Total Distance Travelled
One big away day is bad enough, but the Total Distance Travelled factor isn’t interested in one horrible journey. It adds up all of them. Every motorway. Every service station. Every rail replacement bus that appears just as hope begins to return.
By Dave Learmont
This ranking measures the total round-trip mileage required to complete every away league fixture across the season. The more miles a club has to cover, the higher it ranks.
Because one 300-mile trip is inconvenient.
Thousands of miles, spread across nine months, is a lifestyle.
This ranking is based on the clubs competing across the Premier League and EFL in the 2025/26 season, so every total reflects that season’s specific league line-up. Promotion and relegation can add or remove thousands of miles before a ball has even been kicked.
And unsurprisingly, the top of this table is basically a map of clubs located nowhere near everyone else.
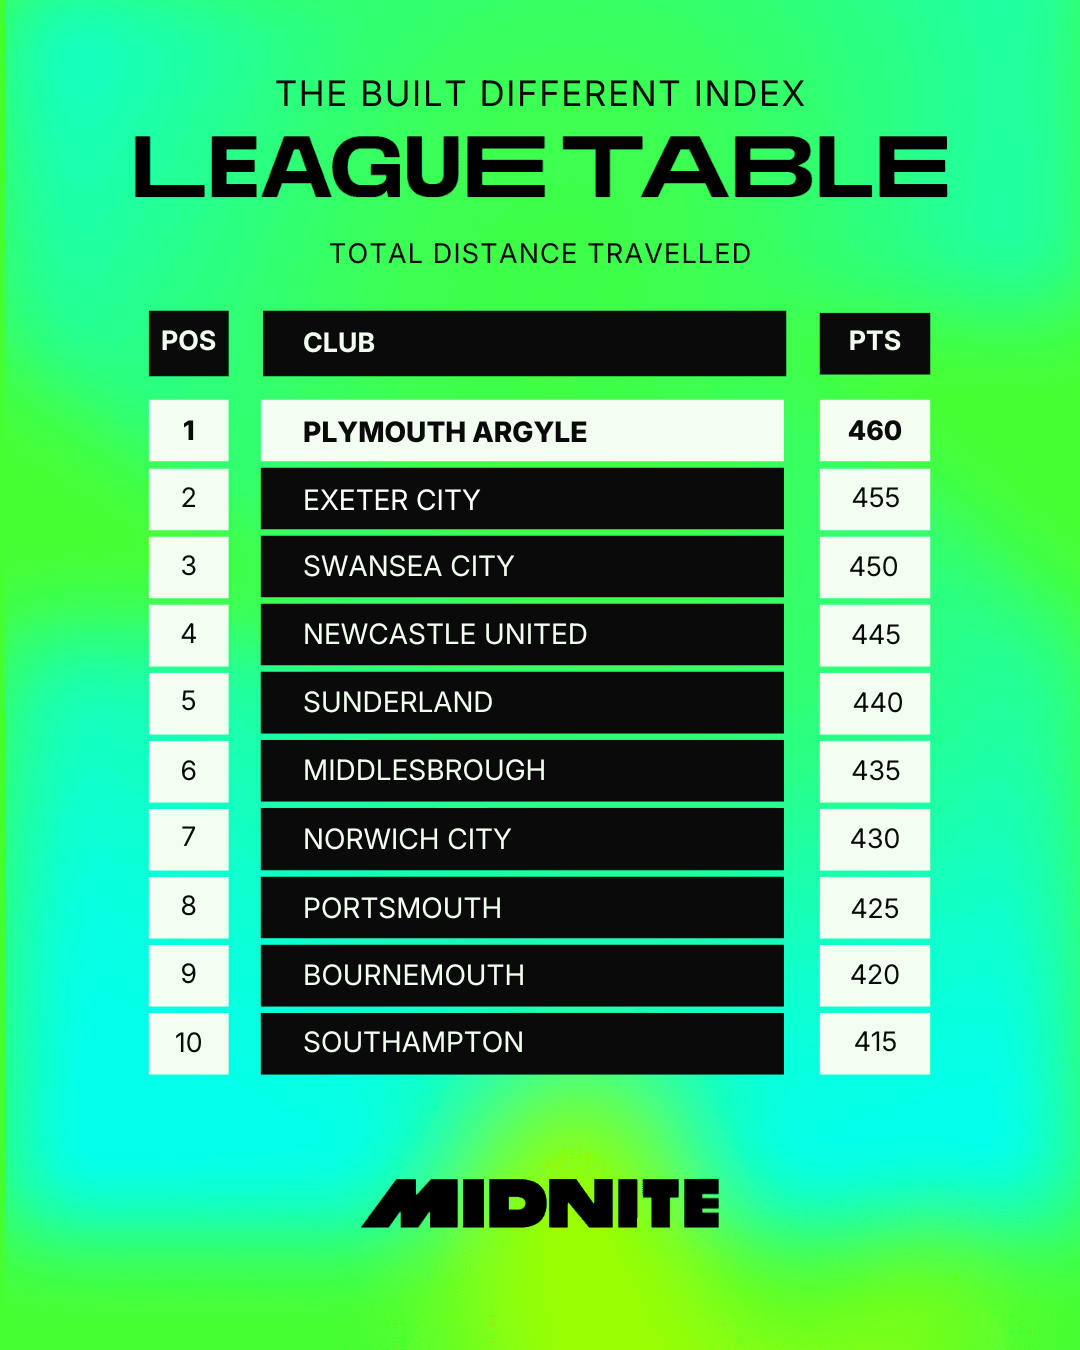
Plymouth Argyle are miles clear… literally.
Top of the table are Plymouth Argyle, with a total round-trip away distance of 10,800 miles. That’s 5,400 miles one way across the season.
Not one journey.
The full league campaign.
Every away fixture added together.
Plymouth rise five places from their overall Built Different position to take first here, with a factor score of 460.
Ten thousand, eight hundred miles is not an away schedule.
It’s a touring itinerary.
For Argyle supporters, the phrase “on the road again” stops being a song lyric and starts becoming an administrative condition.
Exeter are not far behind. Geographically, obviously they are
Second are Exeter City, whose away programme totals 9,900 miles round trip.
That is only 900 miles fewer than Plymouth.
Only.
A word doing some heroic work there.
Exeter rise nine places from their baseline ranking and score 455.
The top two being Plymouth and Exeter tells you everything you need to know about South West football. Beautiful part of the country, lovely grounds, absolute punishment if your team plays away.
Swansea lead the Championship suffering
Swansea City come third, with 8,400 miles of round-trip travel across the season.
They drop one place from their overall Built Different ranking, but still finish as the highest Championship club in this factor.
Swansea’s problem is not one especially ridiculous fixture, it’s the accumulation. Being on the South Wales coast means a long one here, another long one there, and it all starts to add up.
You suddenly look up in April and realise the coach has covered enough ground to develop its own opinions on every service station in Britain.
Newcastle and Sunderland carry the Premier League
Fourth are Newcastle United, with 8,319.8 miles.
Fifth are Sunderland, on 8,208.6 miles.
Separated by just over 111 miles across the whole season.
That’s barely a warm-up by their standards.
Newcastle hold their overall position, while Sunderland rise 13 places.
This is what happens when your nearest geographical neighbours are also the exception. Once the derby is out of the way, the rest of the country is mostly south.
And there is a lot of country.
Middlesbrough complete a North East travel takeover
Middlesbrough sit sixth, with 8,200 miles of round-trip away travel.
That means three of the top six clubs are from the North East.
Newcastle. Sunderland. Middlesbrough.
Different divisions. Same problem... everybody else is bloody miles away.
The region does exceptionally well in this table, which is another way of saying its supporters spend an unreasonable amount of time in coaches, cars and trains.

Norwich and Portsmouth keep the mileage high
Norwich City come seventh with 7,800 miles.
Portsmouth are eighth on 7,700 miles.
Norwich rise six places, while Portsmouth drop three.
Both clubs sit in locations that look manageable until you start adding every away fixture together.
That’s the key difference between this factor and Longest Away Trip.
One giant journey might grab the attention, but total travel shows the grind.
The weekly accumulation of early starts, late finishes and someone opening a packet of boiled eggs before 8am.
Bournemouth’s longest journey does not tell the whole story
Bournemouth topped the Longest Away Trip factor thanks to their 355-mile trip to Newcastle.
Here, they come ninth with 7,452.6 miles across the season.
Still huge, just not Plymouth huge.
That distinction matters. The longest-trip table tells us who has the worst single away day, however, this one asks who spends the whole season living out of a travel mug.
Bournemouth suffer both ways. Very efficient.
Cardiff leap into the top 12
Cardiff City rise 32 places, recording 7,000 miles of round-trip league travel.
That puts them 12th in the factor.
Cardiff topped the Shortest Away Trip ranking because even their nearest league fixture was 104 miles away, so this result tracks.
If the easy one is that far, the full calendar was never going to be kind.
Seven thousand miles later, the numbers have stopped being a surprise and started becoming a cry for help.
Brighton travel nearly 7,000 miles
Overall Built Different winners Brighton & Hove Albion record 6,924.4 miles.
That sees them drop 12 places compared with the main Index, but it’s still a serious total, and they’re still comfortably among the biggest travellers.
Just not quite enough to compete with clubs from the South West, Wales or North East, where geography appears to have declared open war.
Barrow and Gillingham fly the League Two flag
Barrow travel 6,420 miles across the season.
Gillingham cover 6,350 miles.
These totals are a reminder that mileage is not a Premier League problem. If anything, it is more impressive lower down the pyramid.
Smaller budgets mean less glamorous transport, but the same long roads.
Barrow and Gillingham sit at opposite ends of the League Two map, which means neither gets much sympathy from the fixture computer.
Crawley also clock up a serious total
Crawley Town record 6,220 miles, rising nine places.
That puts them above several much more geographically isolated-looking clubs.
Which is where the table gets interesting.
Total mileage is not just about where a club is based.
It is about the shape of the whole division.
Who else is in it.
Where the clusters are.
How often you can find a short one to balance out the monsters.
Football geography is not one distance. It is 23 or 19 of them, depending on the league.
Liverpool and Everton are closer than usual
Everton total 5,876.8 miles.
Liverpool travel 5,817.6 miles.
Everton rise 20 places.
Liverpool fall eight.
The clubs may sit just over two miles apart, but their overall league travel is separated by nearly 60 miles.
That is the kind of difference nobody would ever notice until somebody built an unnecessarily detailed alternative football index.
You’re welcome.
Charlton Athletic are the biggest risers
The biggest climb belongs to Charlton Athletic.
They rise 37 places, moving from 73rd overall to 36th in this factor.
Their season requires 5,500 miles of round-trip travel which, for a London club, stands out.
London teams are normally expected to benefit from a crowded football map and plenty of short journeys, but league composition changes everything.
Charlton’s 2025/26 schedule spreads them far enough across the country to turn a low overall ranking into a top-half travel finish.
Sometimes location helps.
Sometimes the fixture list laughs at location.
London is not one neat travel category
The capital’s clubs are scattered across the table.
- Crystal Palace travel 5,586.8 miles.
- Charlton: 5,500 miles.
- Millwall: 5,400 miles.
- Queens Park Rangers: 5,300 miles.
- West Ham United: 5,294.4 miles.
- Fulham: 5,046.2 miles.
- Chelsea: 5,029.8 miles.
- Brentford: 4,980.8 miles.
- Tottenham Hotspur: 4,973.8 miles.
- Arsenal: 4,855 miles.
Same city. Different divisions, opponents and fixture maps.
Being in London might give you plenty of close neighbours, but it does not guarantee an easy season. Although Arsenal fans may wish to skip the next section.
Arsenal are the biggest fallers
The largest drop belongs to Arsenal.
They fall 54 places, from tenth overall to 64th here.
Their total round-trip mileage is 4,855 miles. That is still a lot of travel in any normal context. But this is not a normal context.
This is a table where Plymouth are doing 10,800.
Arsenal cover fewer than half as many miles.
A large London cluster, combined with a centrally connected location, takes some of the edge off their away calendar.
So while their players might still complain about the schedule, Plymouth fans are invited to send their thoughts by postcard.
Lincoln take an unexpected tumble
Lincoln City also fall sharply, dropping 36 places.
Their total is 4,900 miles.
That puts them level on mileage with Sheffield United and Sheffield Wednesday, although the factor scores separate the clubs.
Lincoln’s fall shows how misleading a central-looking location can be in the other direction.
They may face a few long journeys, but across the whole season their overall travel remains relatively restrained.
A long trip grabs attention.
A compact calendar quietly saves thousands of miles.
The Midlands quietly win by going nowhere
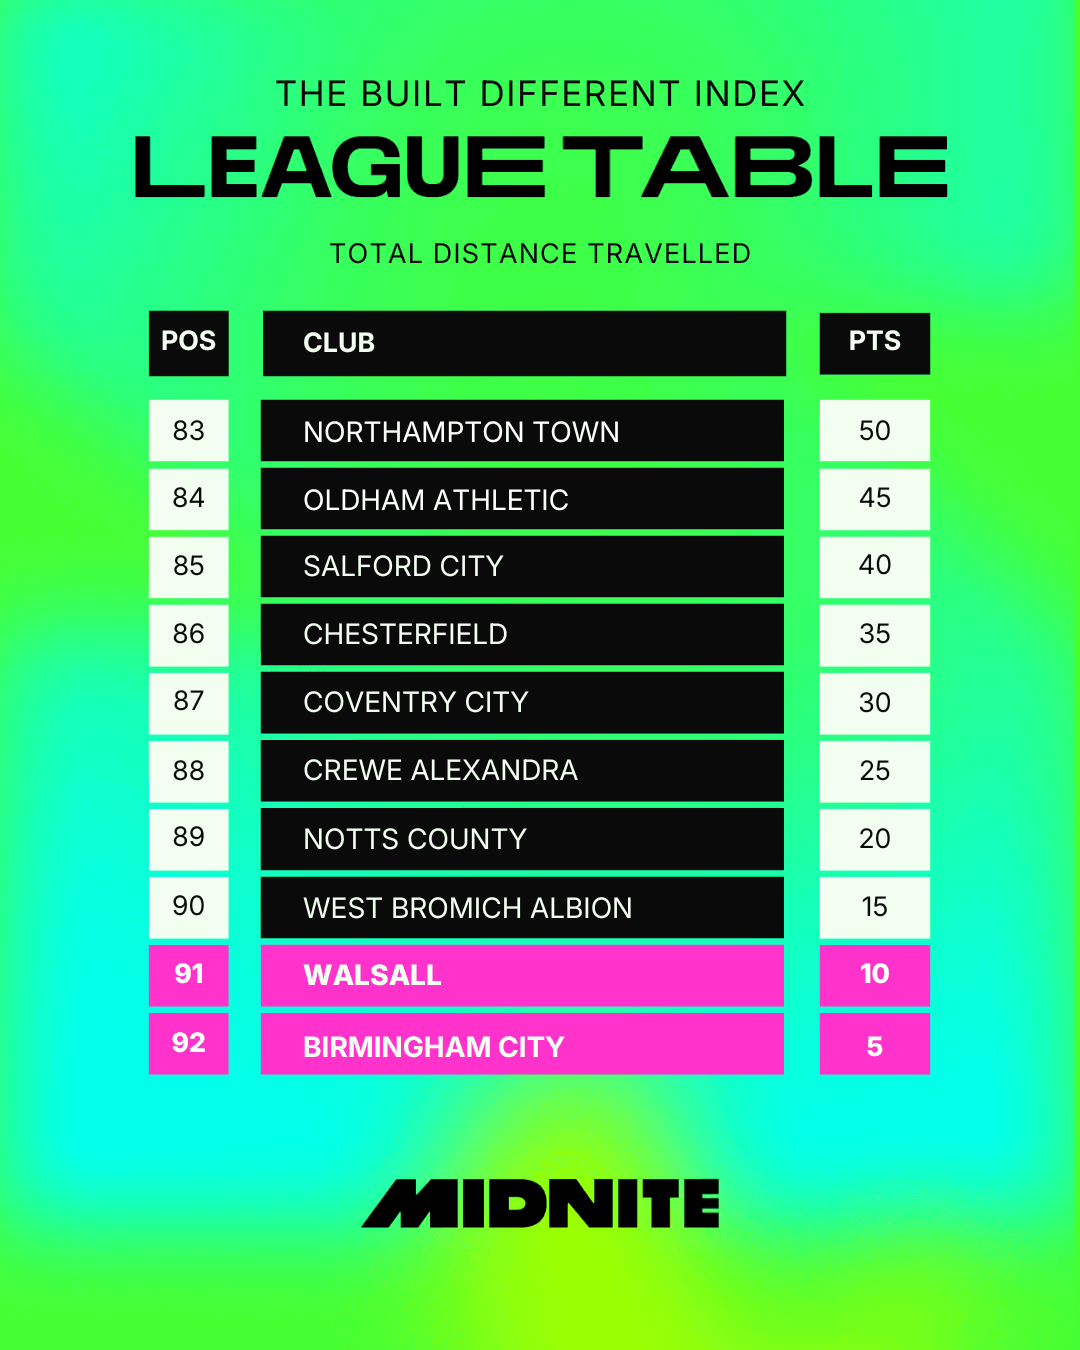
The bottom of the table is dominated by clubs located around the middle of the country.
- Derby County: 4,300 miles.
- Mansfield Town: 4,300 miles.
- Leicester City: 4,200 miles.
- Northampton Town: 4,200 miles.
- Coventry City: 4,100 miles.
- West Bromwich Albion: 3,900 miles.
- Walsall: 3,880 miles.
- Birmingham City: 3,800 miles.
This is the geographical jackpot.
Not glamorous.
Just deeply practical.
A central base means more clubs within reach, fewer monster round trips and far less time wondering whether the M5 is technically a place of residence.
Birmingham City finish bottom again
At the very bottom are Birmingham City, with 3,800 miles of round-trip away travel.
That gives them the lowest total across all 92 clubs and a factor score of 5.
Birmingham also finished last in the full Built Different Index.
Here, though, being bottom is not exactly a disaster.
Their supporters face the least league travel of anyone in the country.
That means fewer Sunday evenings spent staring silently through a coach window, more time settling in to some Saturday night TV.
They may be last in the ranking, but their alarm clocks are doing quite well.
So, what does the Total Distance Travelled table tell us?
It tells us commitment is cumulative.
The longest trip matters, but so do all the others.
The 180-mile one.
The 220-mile one.
The supposedly easy fixture that still means getting home after midnight.
Add them together and the season starts to look very different depending on where your club sits on the map.
The fixture list may give every club the same number of matches, bu it doesn’t give every fan the same journey.
That is what this factor captures.
Not one heroic away day.
A whole season of them.
Fuelled by loyalty, bad coffee and the stubborn belief that this time, surely, the team will make it worthwhile.
Probably.
That’s Built Different.
The Full Table



Company
Help
Product
Support
Payment Methods


Play Responsibly
Midnite is operated by Dribble Media Limited for customers in Great Britain, licensed and regulated by the Great Britain Gambling Commission (Account No. 42647 ) and Midnite Europe Limited for customers in Ireland, licensed by the Gambling Regulatory Authority of Ireland (Licence No. GRAI-0767-RB-26-0001 ).
Dribble Media Limited is incorporated under the laws of England and Wales, with Company Registration No.09555672, and registered address at 86-90 Paul Street, London, EC2A 4NE United Kingdom. Midnite Europe Limited is incorporated under the laws of Malta, with Company Registration No.C90791, and registered address at Level 3 (suit 2327) Tower Business, Tower Street, Swatar Birkirkara BKR4013, Malta. Please play responsibly, for more information and advice visit: www.begambleaware.org or www.gamblingcare.ie


