


The Built Different Index: The Twelfth Man
A big crowd is impressive. A full ground is better. A full ground that represents a serious chunk of the local area is where things start to feel different.
By Callum Wilson
The Twelfth Man combines two Built Different factors: Home Capacity Utilisation and Attendance as a Percentage of Local Authority Population. It rewards clubs that fill the space they have and draw support at a scale that feels significant against the place around them.
This is not simply a list of the country’s biggest attendances. Stadium size matters, but so does density. A smaller club can compete if its ground is packed and its crowd represents a sizeable share of the local population.
The ranking covers the 92 clubs competing across the Premier League and EFL in the 2025/26 season. Home capacity utilisation uses a five-season weighted average, while the local attendance measure compares average home crowds with Local Authority population.
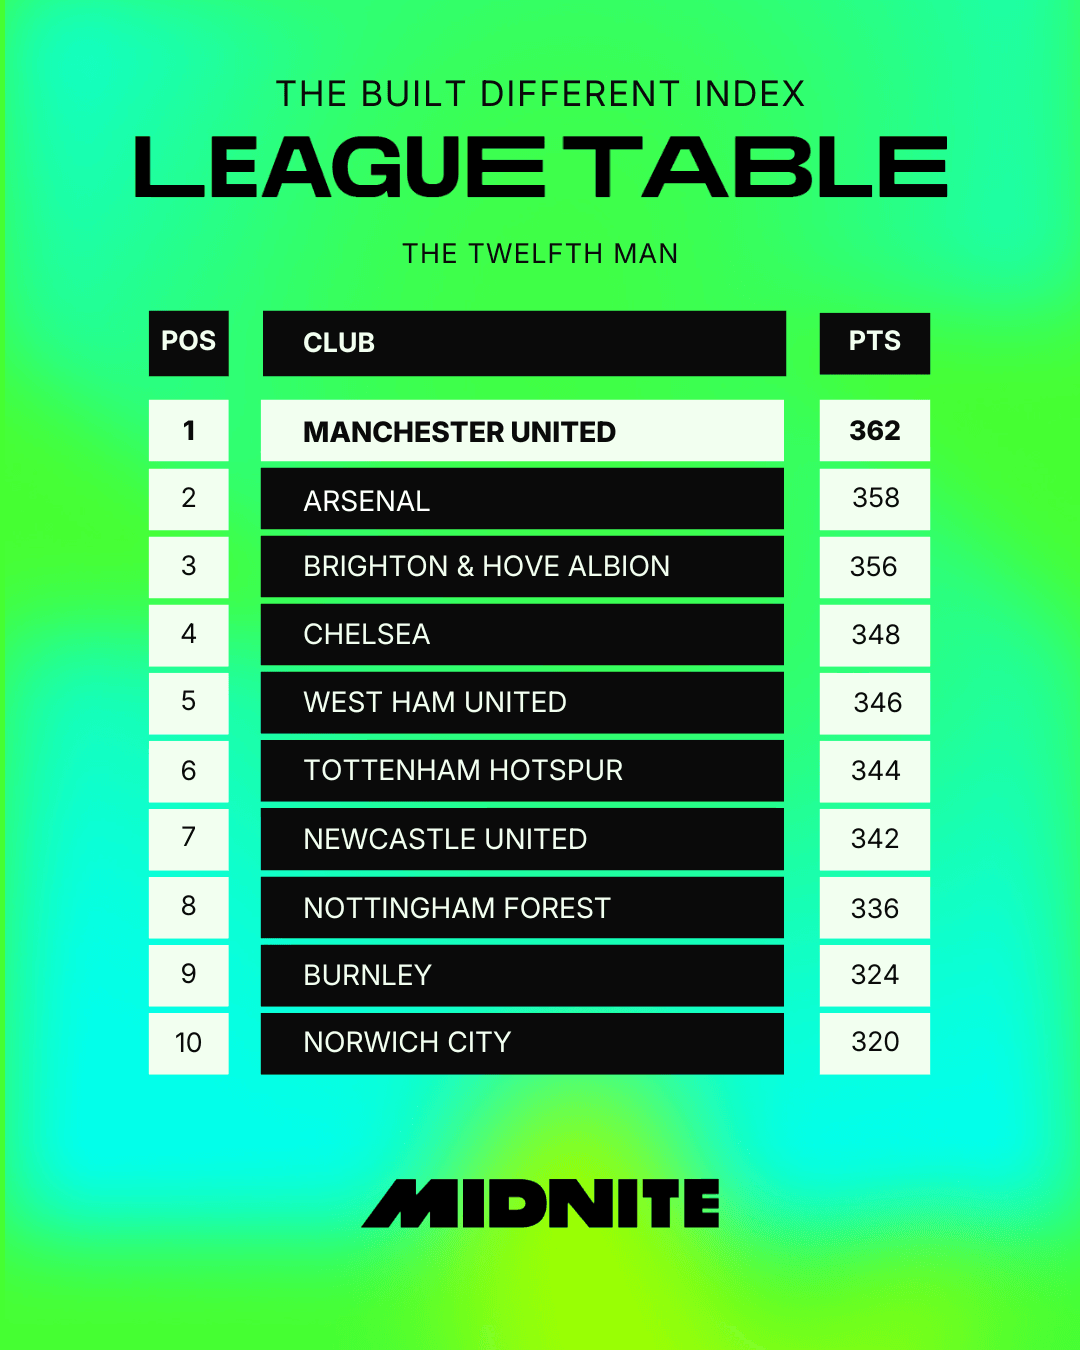
Manchester United take top spot
Manchester United lead The Twelfth Man with a weighted score of 362, climbing 29 places from their overall Built Different ranking.
Old Trafford operates at 99.35% capacity utilisation, while United’s average attendance is equivalent to 31.12% of Trafford’s population.
That combination is difficult to beat. The ground is huge, almost every seat is occupied, and the attendance still represents nearly a third of the Local Authority used in the calculation.
United’s support is often discussed in global terms, but this index gives it a local scale too. Old Trafford does not just hold a lot of people. It holds enough people to noticeably distort the area around it every matchday.
Arsenal are just four points behind
Arsenal finish second with a weighted score of 358.
The Emirates records 99.09% capacity utilisation, while Arsenal’s average attendance equates to 28.03% of Islington’s population.
They sit only four points behind Manchester United, which makes this less a comfortable win and more a crowd-based title race.
Arsenal benefit from strength in both parts of the index. The stadium is routinely full, and the crowd remains enormous relative to the borough around it. There is no weak half of the equation dragging them down.
Brighton complete the top three
Brighton & Hove Albion rank third with a weighted score of 356, only two points behind Arsenal.
Their capacity utilisation is 98.66%, while average attendance equals 31.50% of the Lewes Local Authority population used in the index.
That second figure is the highest of all 92 clubs.
Brighton are therefore slightly less dominant on stadium fill than United or Arsenal, but stronger on local attendance density. The Amex draws a crowd equivalent to almost one in three people in the surrounding authority.
The administrative boundary is doing some work there, but the crowd still has to turn up.
Nottingham Forest are the biggest risers
The standout movement belongs to Nottingham Forest, who climb 72 places from 80th overall to eighth in The Twelfth Man.
Their weighted score of 336 comes from performing strongly in both ingredients. The City Ground runs at 95.88% capacity utilisation, while Forest’s average attendance represents 24.79% of Rushcliffe’s population.
That is exactly the kind of story a combined index should reveal. Forest sit low in the full Built Different table, but once the focus shifts entirely to the relationship between club, ground and local support, they move straight into the top ten.
The City Ground is full, and the crowd looms large against the area used to measure it.
Wolves and Leicester fly up the table
Wolverhampton Wanderers climb 64 places to 12th, while Leicester City rise 58 places to 16th.
Both clubs perform much better here than in the full Index because their grounds are heavily used and their crowds carry real weight locally.
West Bromwich Albion also make a major move, rising 60 places to 27th.
These are clubs whose broader Built Different scores are dragged around by travel, weather, squad age and managerial turnover. Strip all that away and concentrate on support, and the picture changes quickly.

West Ham’s packed ground only gets them fifth
West Ham United topped the individual Home Capacity Utilisation factor with 99.92%, but they finish fifth here with a weighted score of 346.
That is because The Twelfth Man asks for more than a full stadium. West Ham’s crowd is enormous, but when compared with the population of Newham, it is less dominant than the ratios recorded by Manchester United, Arsenal or Brighton.
This is the point of combining the measures. Capacity utilisation tells us whether the seats are used. Local attendance density asks what that crowd means against the surrounding area.
West Ham crush one half of the test. The other half keeps them off the podium.
Bournemouth show how one strong factor is not enough
Bournemouth fall 34 places to 41st, despite the Vitality Stadium operating at 95.07% capacity utilisation.
The problem is the local population measure. Their average crowd represents only 2.83% of the Bournemouth, Christchurch and Poole Local Authority population.
The ground is full because it is small. The wider area is much larger.
Same supporters. Same stadium. Very different result once the second factor enters the calculation.
Fleetwood take one of the sharpest falls
Fleetwood Town drop 46 places to 68th.
Their weighted score is 104, showing how quickly a respectable position in the overall Index can disappear when the question becomes purely about crowd density and stadium usage.
Fleetwood are joined by Accrington Stanley, who fall 44 places to 72nd, and Bromley, who drop 43 places to 86th.
The lower reaches of this table are not necessarily empty grounds. Often they are clubs whose stadiums contain more unused space, whose Local Authorities are large, or whose support is spread across a highly competitive football area.
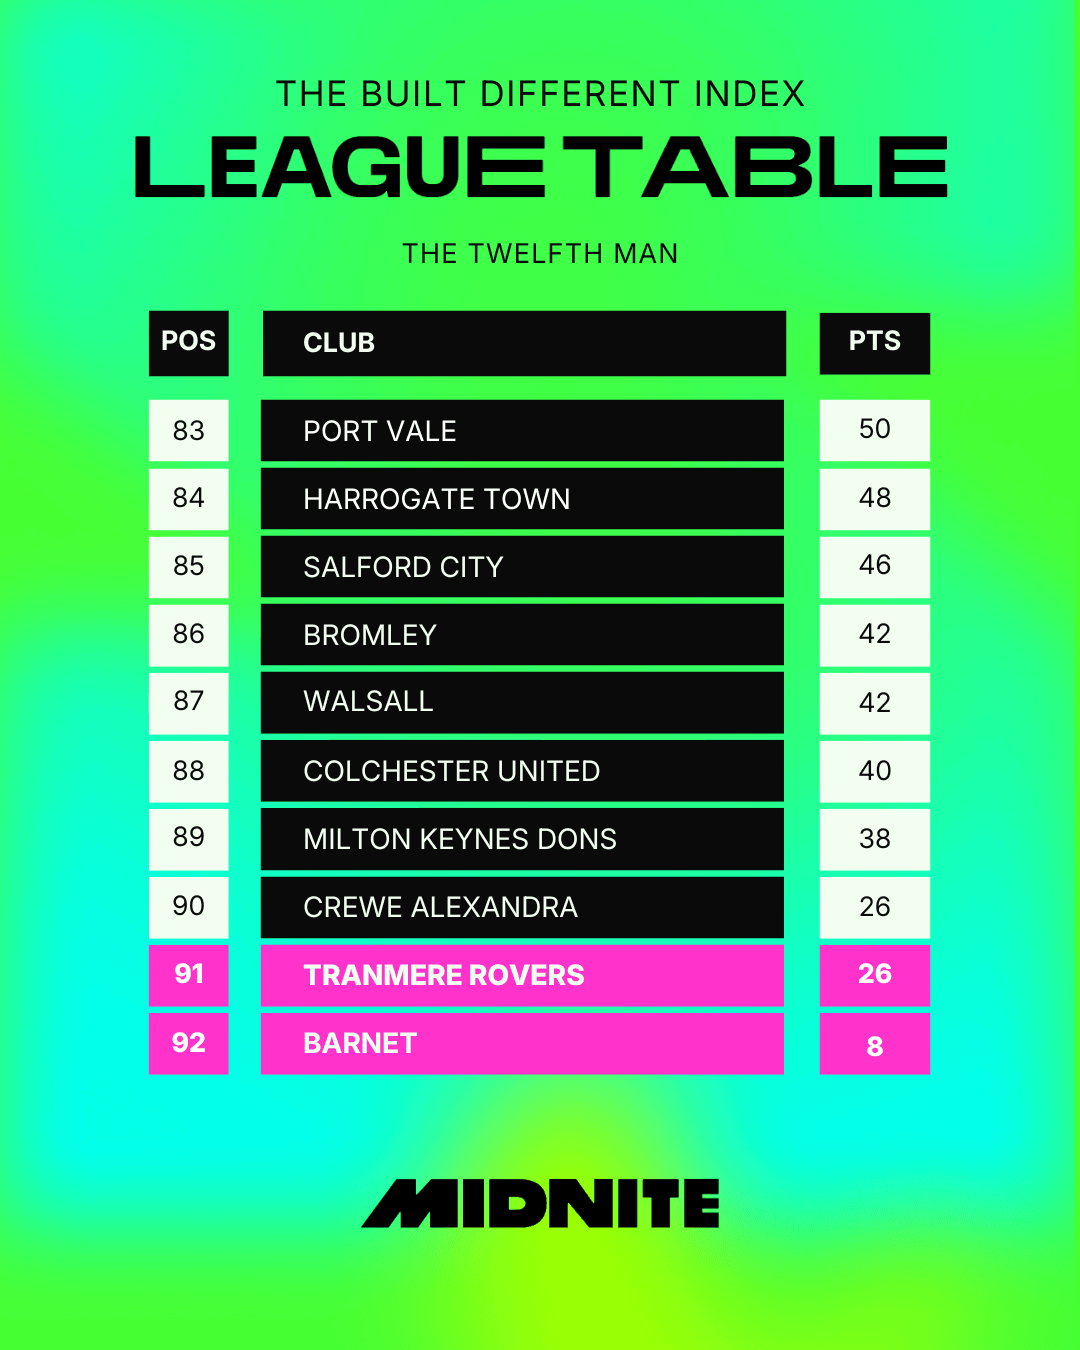
Crewe finish third-bottom
Crewe Alexandra rank 90th with a weighted score of 26, falling eight places from their overall position.
Their support does not score strongly enough in either ingredient to lift them clear of the bottom.
There are clubs with lower raw attendances, but this table does not care about raw attendance alone. It wants a ground that feels full and a crowd that feels large against the place around it.
Crewe miss on both counts.
Tranmere sit one place lower
Tranmere Rovers finish 91st, also on a weighted score of 26. Like Crewe, they fall eight places from the full Index.
Tranmere exist in a football-heavy region, which makes the local support battle harder. Their crowd is being measured against an area containing plenty of alternative loyalties and no shortage of much larger neighbours.
The Twelfth Man does not award sympathy points for market competition.
Barnet finish bottom by a distance
At the foot of the table are Barnet, with a weighted score of just 8.
They fall 56 places, the largest drop in the index.
Barnet’s five-season capacity utilisation is 32.31%, while their average attendance represents 1.00% of Harrow’s population. That combination leaves them well adrift of Crewe and Tranmere.
The Hive is not empty, but it has plenty of unused room. The crowd also makes only a small dent in the Local Authority population used for the calculation.
For this particular test, there is nowhere to hide.
What The Twelfth Man tells us
Manchester United win because they combine scale with density. Old Trafford is nearly full, and the crowd is enormous relative to Trafford. Arsenal and Brighton come close through similarly strong balance across both factors.
Forest are the big revelation, jumping 72 places once the Index focuses on the relationship between support and place. At the bottom, Crewe, Tranmere and Barnet struggle because neither stadium utilisation nor local attendance density gives them enough lift.
The Twelfth Man is not asking who has the loudest supporters or the best atmosphere. Those arguments cannot be solved by a spreadsheet and should never be trusted to one.
It asks something more measurable: when the club plays at home, how much of the ground is occupied, and how much of the local area does that crowd seem to represent?
For some clubs, matchday is an event. For the leaders here, it feels like the whole place has turned up.
The Full Table



Company
Help
Product
Support
Payment Methods


Play Responsibly
Midnite is operated by Dribble Media Limited for customers in Great Britain, licensed and regulated by the Great Britain Gambling Commission (Account No. 42647 ) and Midnite Europe Limited for customers in Ireland, licensed by the Gambling Regulatory Authority of Ireland (Licence No. GRAI-0767-RB-26-0001 ).
Dribble Media Limited is incorporated under the laws of England and Wales, with Company Registration No.09555672, and registered address at 86-90 Paul Street, London, EC2A 4NE United Kingdom. Midnite Europe Limited is incorporated under the laws of Malta, with Company Registration No.C90791, and registered address at Level 3 (suit 2327) Tower Business, Tower Street, Swatar Birkirkara BKR4013, Malta. Please play responsibly, for more information and advice visit: www.begambleaware.org or www.gamblingcare.ie


