


The Built Different Index: Home Capacity Utilisation
A big stadium is only impressive when people turn up. The Home Capacity Utilisation factor measures the five-season weighted average percentage of stadium capacity filled for home league matches. That longer view matters because it rewards sustained demand rather than one promotion bounce, one title chase or one unusually chaotic season.
By Callum Wilson
The Home Capacity Utilisation factor measures the five-season weighted average percentage of stadium capacity filled for home league matches. That longer view matters because it rewards sustained demand rather than one promotion bounce, one title chase or one unusually chaotic season.
The higher the percentage of seats occupied, the higher the club ranks.
This ranking is based on a five-season weighted average and covers the 92 clubs competing across the Premier League and EFL in the 2025/26 season.
West Ham leave almost nothing empty
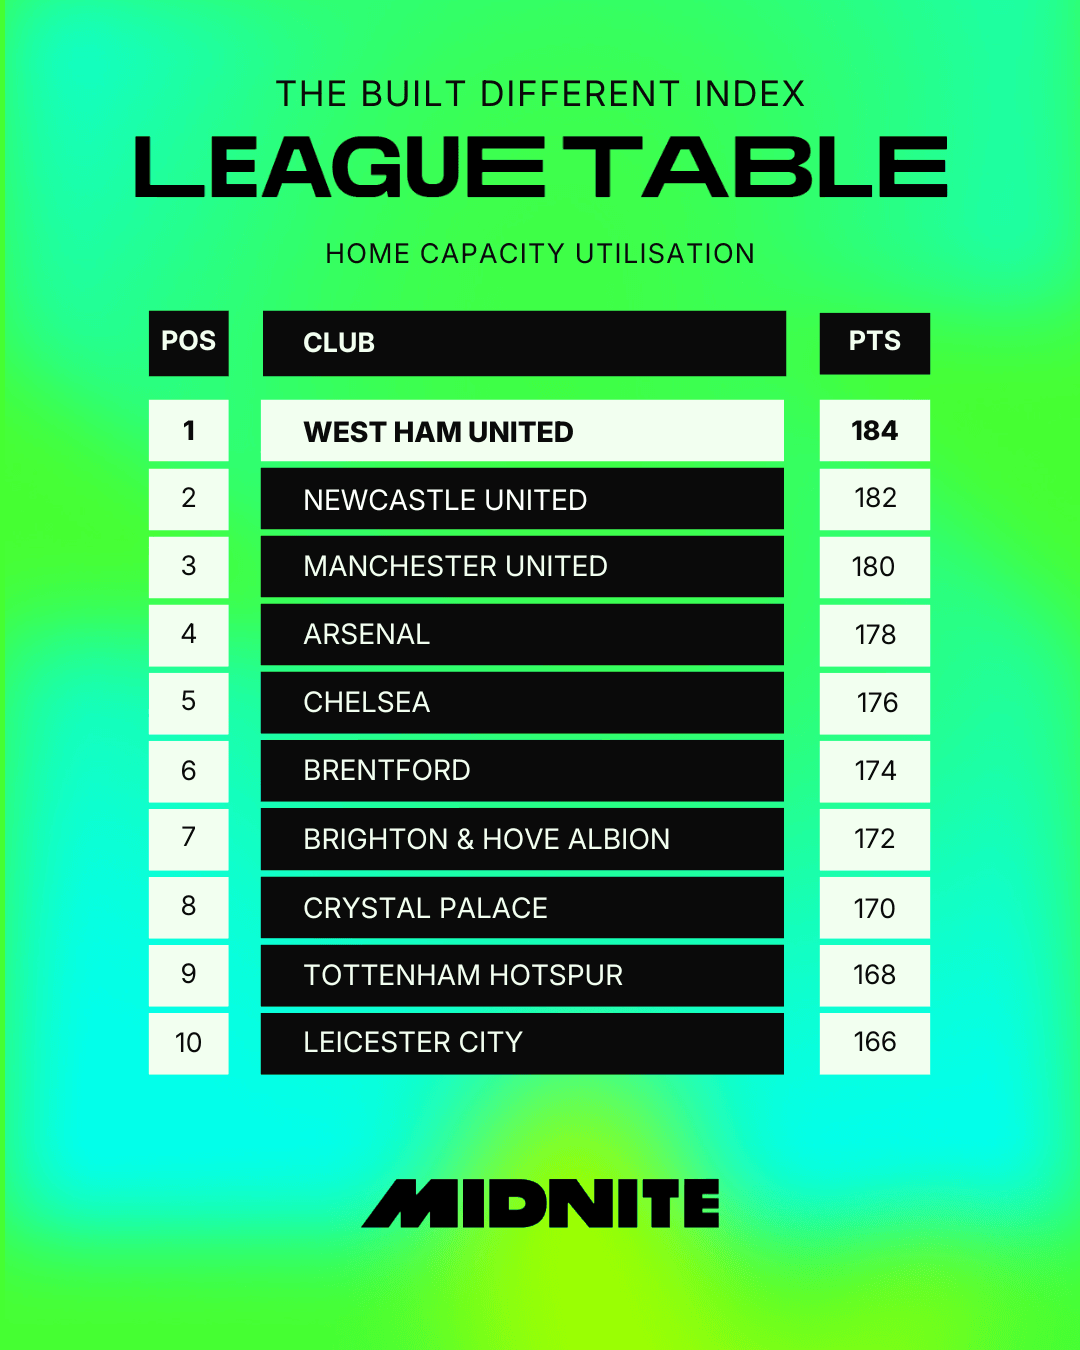
West Ham United top the table with 99.92% capacity utilisation, averaging 62,450 in the 62,500-capacity London Stadium. That is a difference of 50 seats.
Across a ground that size, it is barely a rounding error.
West Ham rise 40 places from their overall Built Different ranking to take first here, which says plenty about how fully the club uses the stadium it has. Whatever the wider debate around the move, the empty-seat argument is not doing much work.
Newcastle are exactly where you’d expect
Newcastle United come second at 99.72%, averaging 52,112 in a stadium that holds 52,258.
There is no great mystery here. St James’ Park is usually full because Newcastle support is not exactly a niche interest in Newcastle.
The more telling point is that this is a five-season weighted average. It is not one good run or one exciting year. The demand holds.
Old Trafford is still packed, even when patience isn’t
Manchester United rank third at 99.35%, with an average attendance of 73,712 against a capacity of 74,197. United climb 27 places from their overall position.
The crowd keeps arriving even when the football, the manager and the general mood around the place have all been less consistent. A full Old Trafford does not mean everyone is enjoying themselves. It means they would rather complain from their seat.
Nottingham Forest are the biggest risers
The standout story in the middle of the table is Nottingham Forest, who rise 66 places from 80th overall to 14th in this factor.
They average 29,150 at the 30,404-capacity City Ground, giving them 95.88% utilisation.
That is exactly what the individual factors are meant to uncover. Forest look unremarkable in the blended Index, but when the question is simply whether the ground is full, they jump straight into the leading pack.
Leicester City produce a similar shift, climbing 64 places to tenth with 97.49%, while Wolves rise 63 places to 13th on 96.06%.

Manchester City sit below Lincoln
One of the more eye-catching comparisons is Manchester City in 31st, with 86.19% utilisation.
That puts them just below Lincoln City, who record 86.23%.
This is not saying Lincoln draw more fans. Obviously not.
It is saying Lincoln fill a slightly larger share of their own stadium.
That is the whole point of using percentage rather than raw attendance, and it is also the sort of decimal-point result that will behave completely normally online.
Blackburn drop hardest
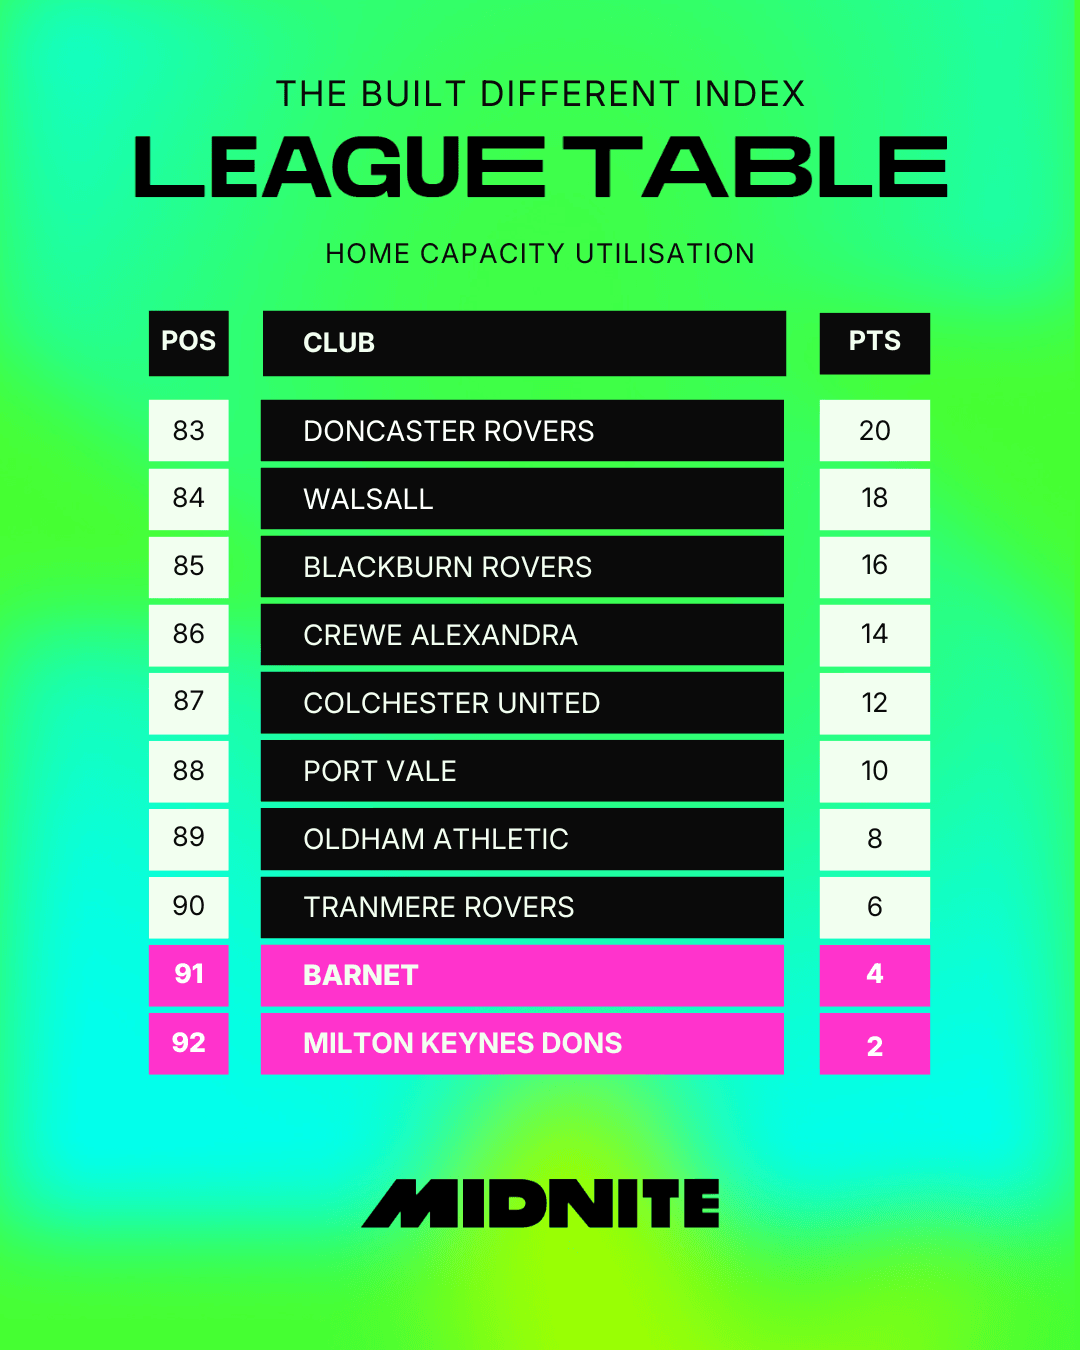
At the other end, Blackburn Rovers are the biggest fallers, dropping 69 places from 16th overall to 85th.
Their five-season weighted average is 47.50%, based on an average attendance of 14,900 at the 31,367-capacity Ewood Park.
Nearly 15,000 supporters is not a small crowd. In a ground built for more than twice that, though, the empty space becomes part of the matchday.
Barnet struggle to fill The Hive
Barnet finish 91st with 32.31% utilisation, averaging 2,100 in a 6,500-capacity stadium.
They fall 55 places from their overall ranking.
The issue is not that 2,100 people is nothing. It is that the ground still has room for more than twice as many again.
MK Dons finish bottom by a distance
At the bottom are Milton Keynes Dons, with 26.56% utilisation.
Their average attendance is 8,100.
Their stadium holds 30,500.
Eight thousand people would make plenty of EFL grounds feel busy. At Stadium MK, it leaves more than 22,000 seats unused.
That is not a crowd problem so much as a stadium-size problem.
What the table tells us
The useful thing about this factor is that it strips away scale.
Manchester United can be compared with Brentford. Newcastle can sit alongside Leicester. Lincoln can edge Manchester City by 0.04 percentage points and immediately cause trouble.
The question is not who has the biggest attendance. It is who fills the space they have.
Over five weighted seasons, West Ham come closest to doing it every week.
At the other end, MK Dons have the most stadium left over.
The Full Table



Company
Help
Product
Support
Payment Methods


Play Responsibly
Midnite is operated by Dribble Media Limited for customers in Great Britain, licensed and regulated by the Great Britain Gambling Commission (Account No. 42647 ) and Midnite Europe Limited for customers in Ireland, licensed by the Gambling Regulatory Authority of Ireland (Licence No. GRAI-0767-RB-26-0001 ).
Dribble Media Limited is incorporated under the laws of England and Wales, with Company Registration No.09555672, and registered address at 86-90 Paul Street, London, EC2A 4NE United Kingdom. Midnite Europe Limited is incorporated under the laws of Malta, with Company Registration No.C90791, and registered address at Level 3 (suit 2327) Tower Business, Tower Street, Swatar Birkirkara BKR4013, Malta. Please play responsibly, for more information and advice visit: www.begambleaware.org or www.gamblingcare.ie


