


The Built Different Index: The Chaos Index
Football chaos is rarely one thing. It is the 300-mile away trip. The rain that never really stops. The new manager arriving with a fresh system before the last one’s initials have been taken off the training kit.
By Callum Wilson
The Chaos Index combines three Built Different factors: Longest Away Trip, Rainfall vs Win Percentage and Managerial Merry-Go-Round. It rewards clubs dealing with a difficult mix of geography, weather and dugout instability.
The longest-trip factor captures the single worst journey in the 2025/26 league season. Rainfall vs Win Percentage measures how much winning a club has managed in wet conditions. Managerial Merry-Go-Round tracks five seasons of managers used, permanent departures and caretaker spells.
Put together, it is football’s stress test.
The ranking covers the 92 clubs competing across the Premier League and EFL in the 2025/26 season. Managerial data is accurate as of 20 July 2026, while the rainfall calculation uses a five-season average win percentage.
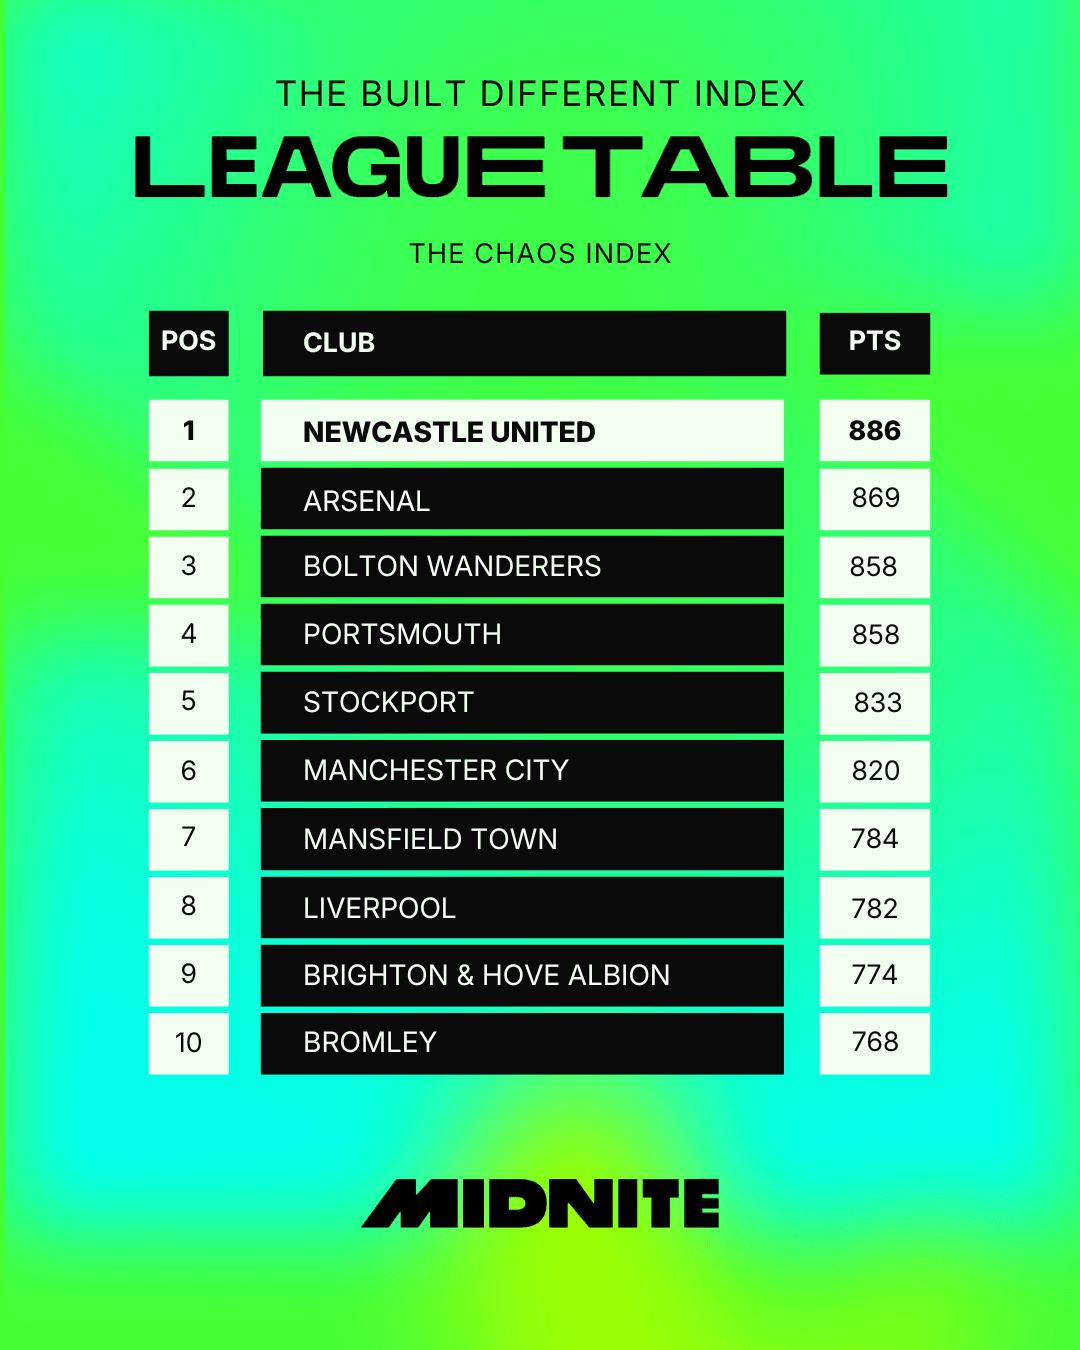
Newcastle take the chaos crown
Newcastle United top the table with a weighted score of 886, rising three places from their overall Built Different ranking.
Their case is built across all three parts rather than one freak result. The trip to Bournemouth is 355 miles one way, matching the longest journey anywhere in the Premier League. Their North East conditions give the rainfall score useful weight, while two managers, one permanent departure and one caretaker spell keep them clear of the ultra-stable clubs.
Newcastle are not the most chaotic club in any one obvious sense. They simply bring enough distance, enough weather and enough managerial movement to win the combined argument.
A balanced side, just not in the way coaches usually mean it.
Arsenal nearly win by being stable
Arsenal finish second with 869 points, eight places above their overall ranking.
That may sound odd in an index with “chaos” in the title, because Arsenal have been the most stable club in the managerial table: one manager, no permanent departures and no caretaker spells across five seasons.
But the factor is scored so stability performs strongly, while Arsenal also bring a sizeable longest trip and a healthy rainfall-versus-win score. Their five-season win rate does a lot of work when multiplied by London rainfall.
This is organised chaos. The away day is long, the weather is unhelpful, but at least nobody has changed the manager on Monday morning.
Bolton complete the top three
Bolton Wanderers sit third with a weighted score of 858, climbing 11 places. Their longest trip is 295 miles to Plymouth, while North West rainfall gives them a strong platform in the weather calculation. They have also remained relatively controlled in the dugout, using two managers with one permanent departure and one caretaker spell.
Bolton’s result shows how the index is meant to work. You do not need Watford-level managerial turnover to rank highly. A long enough journey, regular rain and some continuity can be just as effective.
Portsmouth finish level with Bolton on 858, although the ordering keeps Pompey in fourth.
Bromley are the biggest risers
The biggest move belongs to Bromley, who jump 33 places from 43rd overall to tenth.
Their weighted score of 768 comes from a strong blend: a substantial longest journey, a respectable rainfall score and complete managerial stability across the five-season period, with one manager and no departures or caretaker spells.
That last part matters. Bromley are not climbing because the board has spent five years firing people into the sun. They rise because the combined index rewards clubs that deal with external chaos without constantly manufacturing more of it.
Very mature. Slightly disappointing for a category called Chaos Index.

Mansfield are another stability-powered surprise
Mansfield Town climb 31 places to seventh, scoring 784.
Like Bromley, they have used one manager across the period, with no permanent departures and no caretakers. Their long-distance travel and rainfall performance then provide the turbulence.
Mansfield’s chaos comes from the fixture list and the sky.
The board, unusually, has stayed out of it.
Manchester City rise through rain conquered
Manchester City move 18 places to sixth with 820 points.
They topped the Rainfall vs Win Percentage factor because roughly 867mm of annual rain, multiplied by a 78% five-season win rate, produced the highest “volume of rain conquered” score in the country.
Their longest trip remains significant, while the managerial element is still stable despite one permanent transition across the five-year window.
City’s version of chaos is extremely controlled: travel a long way, play in the rain, win anyway, go home.
Annoying, really.
Salford climb 33 places from the middle
Salford City also rise 33 places, reaching the upper-middle section with a weighted score of 603.
They combine a sizeable furthest journey with a decent rainfall result and relatively low managerial churn: three managers used, two permanent departures and one caretaker spell.
It is not enough for the top ten, but it is one of the sharpest changes in the table. Once distance, wet-weather results and managerial stability are isolated, Salford look very different from their broader Built Different position.
Sunderland fall furthest
The biggest drop belongs to Sunderland, who slide 44 places from 18th overall to 62nd.
Their longest away trip is a brutal 345 miles to Bournemouth, so geography is not the problem. The issue comes from the other two factors.
Sunderland finished bottom of Rainfall vs Win Percentage, with around 650mm of annual rainfall multiplied by a five-season win rate of 28%. They also used five managers, recorded four permanent departures and had three caretaker spells.
Plenty of distance. Plenty of dugout movement. Not enough winning in the wet. Chaos without the useful bit.
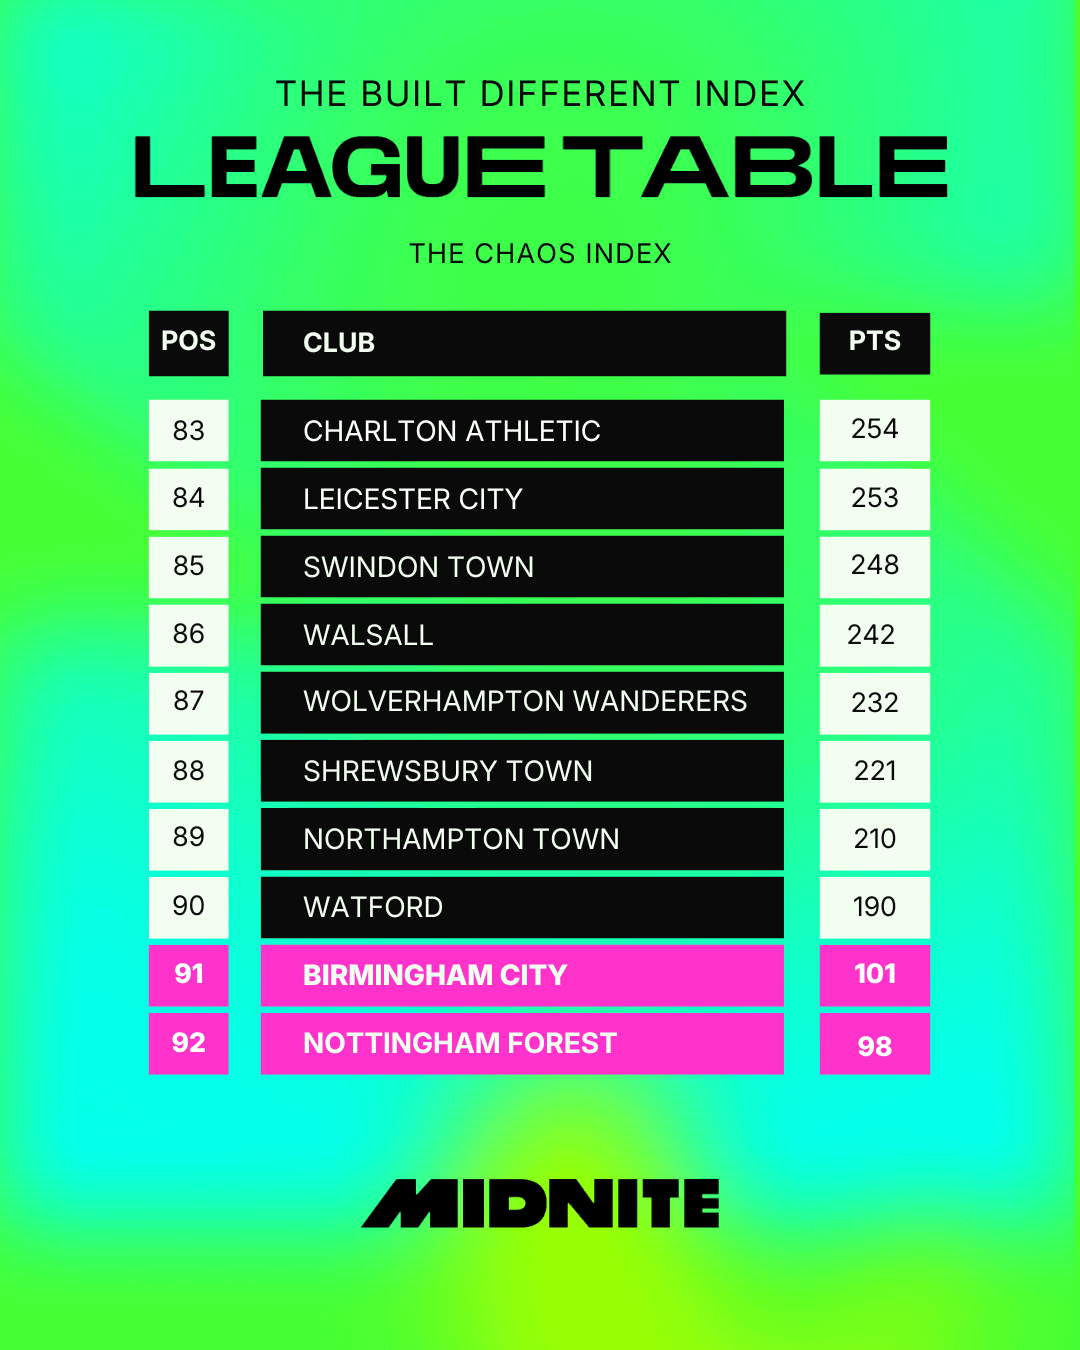
Watford’s managerial reputation cannot save them
Watford finish 90th with a weighted score of 190.
That is striking because they were bottom of the Managerial Merry-Go-Round table, using ten managers, recording nine permanent departures and going through two caretaker spells.
You might expect that level of churn to make them automatic Chaos Index champions. It does not.
Their longest-trip and rainfall scores are too weak, so the managerial madness cannot carry the whole calculation. The index wants chaos from several directions, not one chairman repeatedly pressing the same button.
Birmingham finish second-bottom
Birmingham City rank 91st with a weighted score of 101, moving up one place from their overall position.
Their furthest league trip is only 165 miles, the joint-shortest “longest trip” in the country. Their rainfall-versus-winning score is also near the bottom, and six managers across five seasons is not enough to offset those weak results elsewhere.
Birmingham have had instability. They just have not had enough mileage or rain-assisted winning to make it premium chaos.
Nottingham Forest finish bottom
At the foot of the table are Nottingham Forest, with a weighted score of 98. Forest’s longest trip is 195 miles to Bournemouth, modest by the standards of this index. Their rainfall-versus-win result is also extremely low, with roughly 710mm of rain and a five-season win rate of 34%.
They do bring managerial movement — seven managers, six permanent departures and one caretaker spell — but, like Watford, one chaotic ingredient cannot rescue the whole dish.
Forest were brilliant in The Twelfth Man because the City Ground is full and locally significant.
Here, the weather is not conquered and the journeys are not extreme enough.
Different index. Very different verdict.
What the Chaos Index tells us
Newcastle win because they have the full package: one of the longest journeys in the country, enough wet-weather performance and enough managerial movement to add friction without becoming complete farce.
Arsenal reach second through the opposite route. They handle the travel and rain while refusing to join the dugout carousel. Bolton complete the top three with long journeys, North West weather and relative stability.
At the bottom, Watford, Birmingham and Forest prove that chaos cannot be one-dimensional. Sacking managers is not enough. Neither is one long trip or a wet postcode.
You need the complete experience.
Miles on the clock. Rain in your face. Another bloke in the technical area wondering where the kettle is.
That is the Chaos Index.
The Full Table



Company
Help
Product
Support
Payment Methods


Play Responsibly
Midnite is operated by Dribble Media Limited for customers in Great Britain, licensed and regulated by the Great Britain Gambling Commission (Account No. 42647 ) and Midnite Europe Limited for customers in Ireland, licensed by the Gambling Regulatory Authority of Ireland (Licence No. GRAI-0767-RB-26-0001 ).
Dribble Media Limited is incorporated under the laws of England and Wales, with Company Registration No.09555672, and registered address at 86-90 Paul Street, London, EC2A 4NE United Kingdom. Midnite Europe Limited is incorporated under the laws of Malta, with Company Registration No.C90791, and registered address at Level 3 (suit 2327) Tower Business, Tower Street, Swatar Birkirkara BKR4013, Malta. Please play responsibly, for more information and advice visit: www.begambleaware.org or www.gamblingcare.ie


