


The Built Different Index: Average Rainfall X Win %
This is where the Built Different Index starts requiring a calculator and a waterproof notebook. The Rainfall vs Win Percentage factor combines regional annual rainfall with each club’s five-season average win rate.
By Callum Wilson
The Rainfall vs Win Percentage factor combines regional annual rainfall with each club’s five-season average win rate. The formula is:
Rainfall × Win % = Built Different Score
In plain English, it measures the volume of rain conquered.
A strong win rate in a relatively dry part of the country earns a decent score. A strong win rate somewhere that seems to spend half the year under a weather warning earns a much bigger one. Rain alone is not enough, and neither is winning. You need both.
The ranking covers the 92 clubs competing across the Premier League and EFL in the 2025/26 season, using regional annual rainfall and a five-season average win percentage.
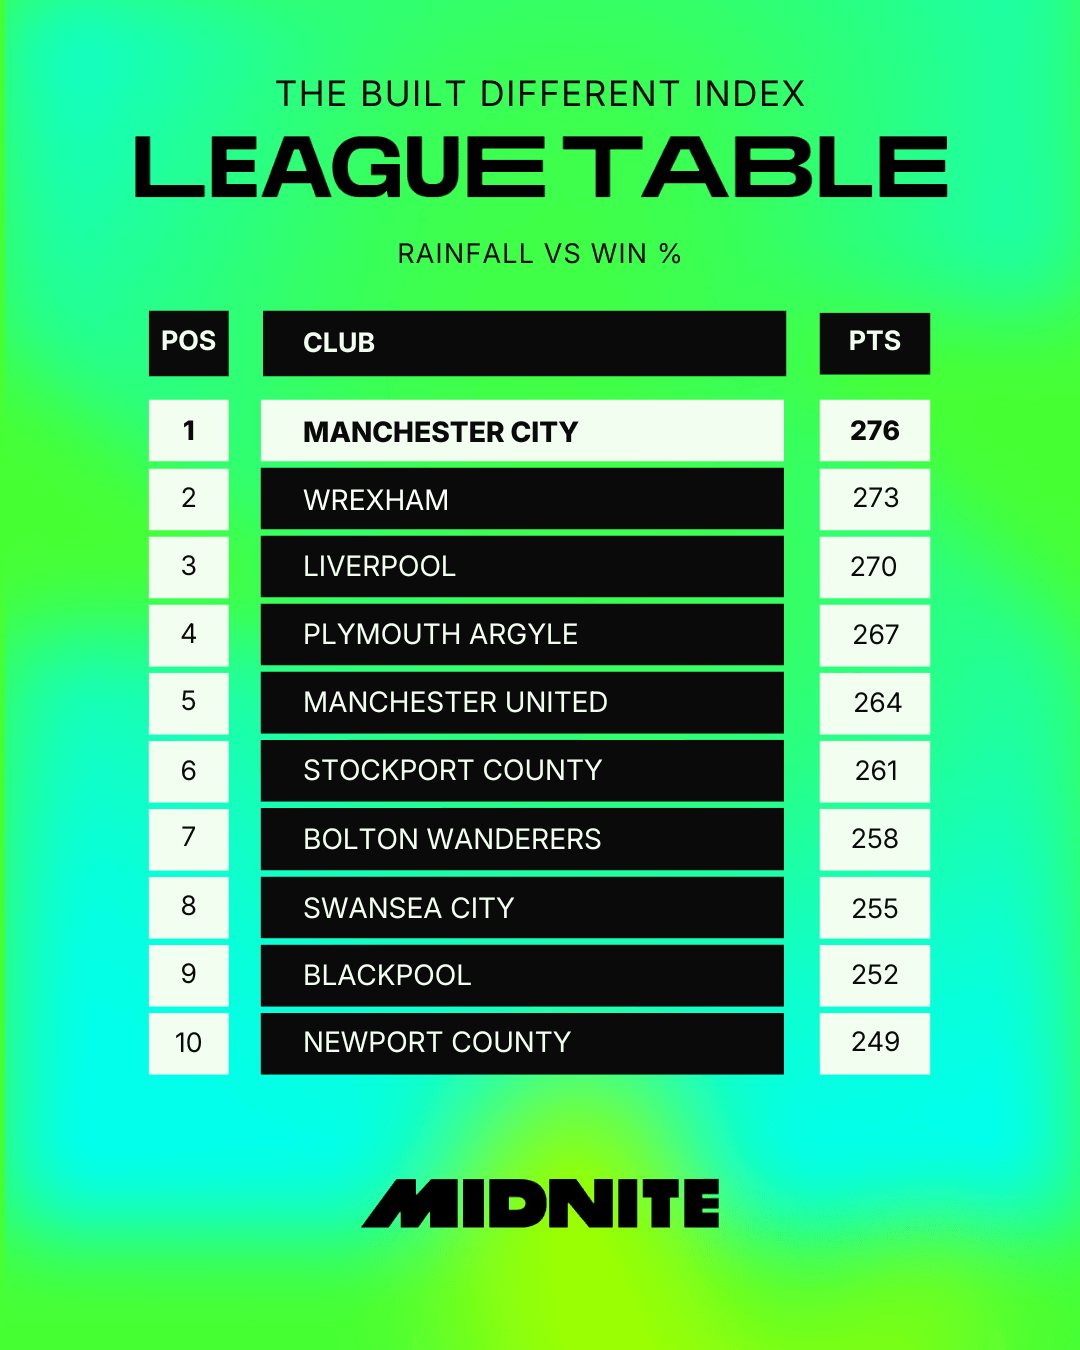
Manchester City conquer the most rain
Manchester City top the table with a Rainfall Index of 676.26, based on roughly 867mm of annual rainfall and a five-season win rate of 78%.
The maths is doing exactly what it should here. Manchester is wet, City win constantly, and multiplying the two produces the highest score in the country.
They rise 23 places from their overall Built Different ranking.
This is not simply dominance. It is dominance conducted under a low grey ceiling, with the pitch slick and somebody in the front row wearing a plastic poncho.
Wrexham turn Welsh weather into second place
Wrexham come second with an index score of 650.00.
Their estimated rainfall is around 1,000mm, while their five-season win rate sits at 65%.
That lower win rate compared with Manchester City is offset by heavier rainfall. Which is the whole point of the factor: winning often is impressive, but winning often while the weather is making a committed effort to ruin everyone’s afternoon counts for more.
Wrexham rise 19 places from the overall table and finish above Liverpool despite winning less frequently.
Rain has entered the title race.
Liverpool complete the top three
Liverpool sit third with a Rainfall Index of 605.52, combining approximately 841mm of rain with a 72% win rate.
That is less rainfall and fewer wins than Manchester City, but still comfortably enough to leave most of the country behind.
Liverpool climb 16 places from their baseline ranking, which feels fitting for a club whose best football has often been played at high speed on a surface that looks freshly pressure-washed.
Plymouth are the clearest proof of the formula
Plymouth Argyle rank fourth with a score of 520.00, based on roughly 1,000mm of rain and a 52% win rate.
This is where the calculation becomes easier to understand.
Arsenal, for example, have a much higher win rate at 68%, but only around 620mm of annual rainfall, giving them a lower score of 421.60 and 14th place.
Plymouth win less often, but they do it in far wetter conditions.
The table is not asking who wins the most. It is asking who gets the most winning done while being rained on.
Oldham are the biggest risers
The biggest jump belongs to Oldham Athletic, who climb 75 places from 88th overall to 13th.
Their Rainfall Index is 427.50, created by approximately 950mm of rain and a 45% win rate.
A 45% win rate would not usually threaten the top end of any national ranking. Add North West rainfall, though, and suddenly Oldham are mixing with Arsenal and Aston Villa.
This is the Built Different Index at its best: taking something fairly ordinary, adding weather, and producing an argument nobody knew they needed.

Notts County make dry-weather efficiency count
Notts County rise 69 places to 17th, with an index score of 411.80.
They receive only around 710mm of rain, but a strong 58% win rate keeps them high.
That makes them an interesting contrast with clubs such as Barrow, who get much more rain but win less often. Barrow’s 1,000mm and 42% win rate produce a slightly higher score of 420.00.
One club leans on results.
The other leans on precipitation.
Both end up in roughly the same place.
Burnley prove rain cannot do all the work
Burnley receive approximately 1,024mm of annual rainfall, one of the highest figures in the table.
Their five-season win rate, however, is 28%, leaving them 58th with an index score of 286.72.
This is an important part of the formula. Being wet is not an achievement by itself.
You have to win as well. Otherwise, it is just a miserable afternoon.
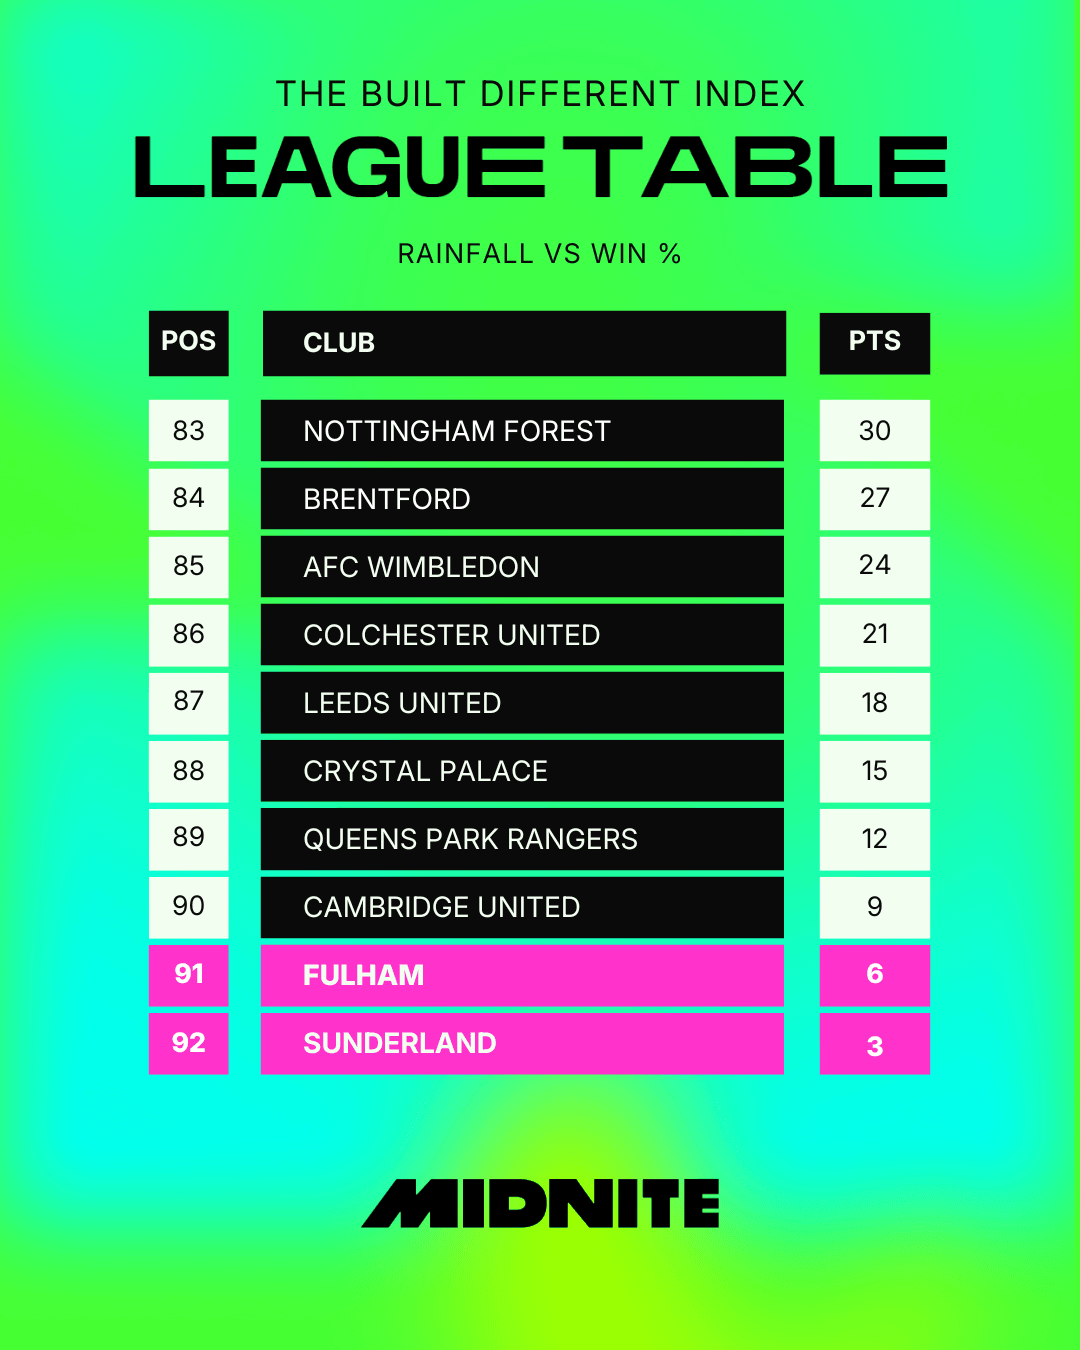
Cambridge are dry and not winning enough
At the bottom end, Cambridge United rank 90th with an index score of 220.40.
They combine around 580mm of annual rainfall, the lowest figure shown in the table, with a 38% win rate.
There is no multiplier rescue here. Cambridge do not receive enough rain to compensate for a modest win percentage, so they remain near the bottom.
Reasonable weather. Reasonable results. Terrible for this particular ranking.
Fulham finish second-bottom
Fulham sit 91st with a score of 217.00, based on approximately 620mm of rain and a 35% win rate.
They fall 44 places from their overall position.
London is relatively dry by the standards of this index, so a lower win rate gets exposed quickly. There is simply not enough weather available to inflate the score.
Fulham needed more wins, more rain or ideally both.
Sunderland finish last
At the bottom are Sunderland, whose score of 182.00 comes from roughly 650mm of annual rainfall and a five-season win rate of 28%.
They drop 74 places, the biggest fall in the factor.
The rainfall is not especially low, but the win rate leaves it with very little to multiply.
That is the cruel simplicity of the formula. You can have difficult conditions, but unless you beat someone in them, the Index is unmoved.
What the table tells us
Manchester City top the ranking because they combine heavy North West rainfall with an extraordinary win rate. Wrexham come close because the weather is worse, even if the results are slightly less relentless. Liverpool remain firmly in the downpour-chasing pack.
At the other end, Cambridge, Fulham and Sunderland lack the right mixture. Some are too dry, some do not win enough, and Sunderland manage to get caught between both problems.
This factor does not measure who plays the best football.
It measures who has won the most while the sky is actively trying to stop them.
A completely unnecessary calculation.
Which is exactly why it belongs here.
The Full Table



Company
Help
Product
Support
Payment Methods


Play Responsibly
Midnite is operated by Dribble Media Limited for customers in Great Britain, licensed and regulated by the Great Britain Gambling Commission (Account No. 42647 ) and Midnite Europe Limited for customers in Ireland, licensed by the Gambling Regulatory Authority of Ireland (Licence No. GRAI-0767-RB-26-0001 ).
Dribble Media Limited is incorporated under the laws of England and Wales, with Company Registration No.09555672, and registered address at 86-90 Paul Street, London, EC2A 4NE United Kingdom. Midnite Europe Limited is incorporated under the laws of Malta, with Company Registration No.C90791, and registered address at Level 3 (suit 2327) Tower Business, Tower Street, Swatar Birkirkara BKR4013, Malta. Please play responsibly, for more information and advice visit: www.begambleaware.org or www.gamblingcare.ie


