


The Built Different Index: Attendance as a % of Local Population
Raw attendance tells you how many people were there. This factor asks a better question: how much of the local area turned up?
By Callum Wilson
The Attendance as a Percentage of Local Population ranking compares each club’s average home league attendance with the population of its Local Authority. It is designed to pick out clubs whose support feels unusually dense, where matchday does not just fill a stadium but pulls in a noticeable share of the surrounding area.
The ranking covers the 92 clubs competing across the Premier League and EFL in the 2025/26 season. Because it uses Local Authority populations, the result is also shaped by administrative boundaries: some clubs sit inside compact authorities, while others are measured against much larger areas.
That is not a bug. It is part of what makes the table interesting.
Brighton top the lot
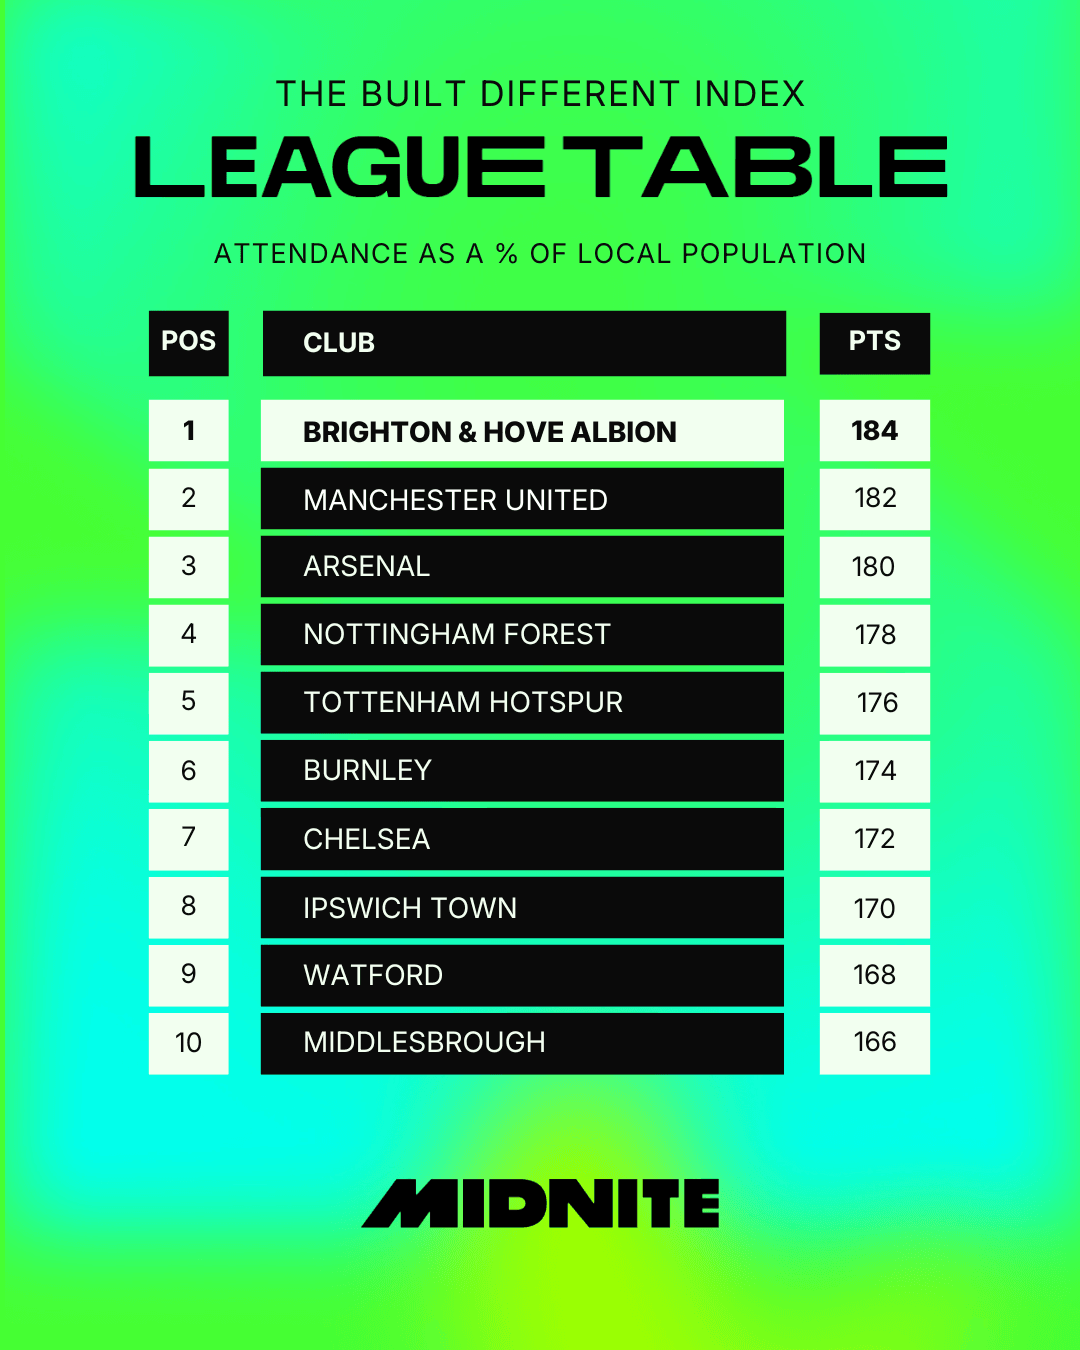
Brighton & Hove Albion rank first, with an average attendance of 31,500 equal to 31.50% of the Lewes population, listed at roughly 100,000.
That means the Amex draws a crowd equivalent to almost one in three people in the surrounding Local Authority. Brighton already sit first in the overall Built Different Index, so there is no dramatic rise here. This is simply another category where they are annoyingly good.
The result also shows why the choice of geography matters. Brighton’s ground sits within Lewes District rather than Brighton and Hove itself, producing one of the strongest ratios in the country. The figure measures exactly what the Index says it measures, even if the football identity crosses the administrative border without asking permission.
Manchester United make 73,000 look local
Manchester United come second at 31.12% of Trafford’s population, based on an average attendance of 73,534 against a population of roughly 236,300.
United climb 28 places from their overall ranking.
The raw crowd is enormous, but the ratio makes it feel stranger. Old Trafford does not merely attract a lot of people; on this measure, it draws the equivalent of nearly a third of the entire Local Authority every home game.
Not all of those supporters live in Trafford. Clearly.
But this is a density measure, not a postcode audit.
Arsenal put Islington at 28%
Arsenal complete the top three, with an average attendance of 60,704 equal to 28.03% of Islington’s population.
They rise seven places from their overall position.
The Emirates sits in one of the most densely populated parts of the country, yet the size of Arsenal’s crowd still produces a ratio of more than one in four local residents.
That is a lot of red shirts for one borough, although the Piccadilly line on a matchday had already hinted at this.
Nottingham Forest are the biggest risers
The standout story belongs to Nottingham Forest, who jump 76 places from 80th overall to fourth.
Their average attendance of 29,500 represents 24.79% of Rushcliffe’s population, listed at around 119,000.
That is the biggest movement anywhere in the factor, and it comes partly from the City Ground’s location within a relatively compact Local Authority.
Forest’s support has not suddenly appeared because someone changed the spreadsheet. The measure has simply found the particular angle from which it looks most intense.
Almost a quarter of the local population, in attendance terms, is a serious footprint.

Burnley are the purest football-town result
Burnley rank sixth with 22.36%, based on an average attendance of 21,172 against a local population of roughly 94,700.
This is perhaps the result that best matches the spirit of the category.
No administrative quirk is needed to make Burnley feel like a football town. Turf Moor sits inside a relatively small borough, and the club pulls a crowd equivalent to more than one in five residents.
That is the sort of ratio where a home fixture changes the rhythm of the place. Roads clog, pubs fill and anyone trying to do something unrelated to football has picked the wrong afternoon.
Watford climb into the top ten
Watford rise 59 places to ninth, with their average crowd of 19,000 equal to 18.62% of the Watford population.
They sit above Middlesbrough, Norwich, West Ham and Newcastle in this factor.
Again, scale matters less than concentration. Watford are not drawing the biggest crowd in that group, but their support occupies a larger share of the Local Authority around them.
The club does not need to dominate the national conversation. It is doing a fair job of occupying Watford.
Bournemouth suffer the biggest fall
At the other end of the movement table, Bournemouth fall 62 places, from seventh overall to 69th.
Their average attendance of 11,307 represents 2.83% of the combined Bournemouth, Christchurch and Poole population, listed at around 400,000.
The Vitality Stadium is small and usually full, which helped Bournemouth rank highly for home capacity utilisation. This category asks something different, and the wider Local Authority works against them.
Same crowd.
Same club.
Completely different result once the denominator changes.
Salford barely move the local needle
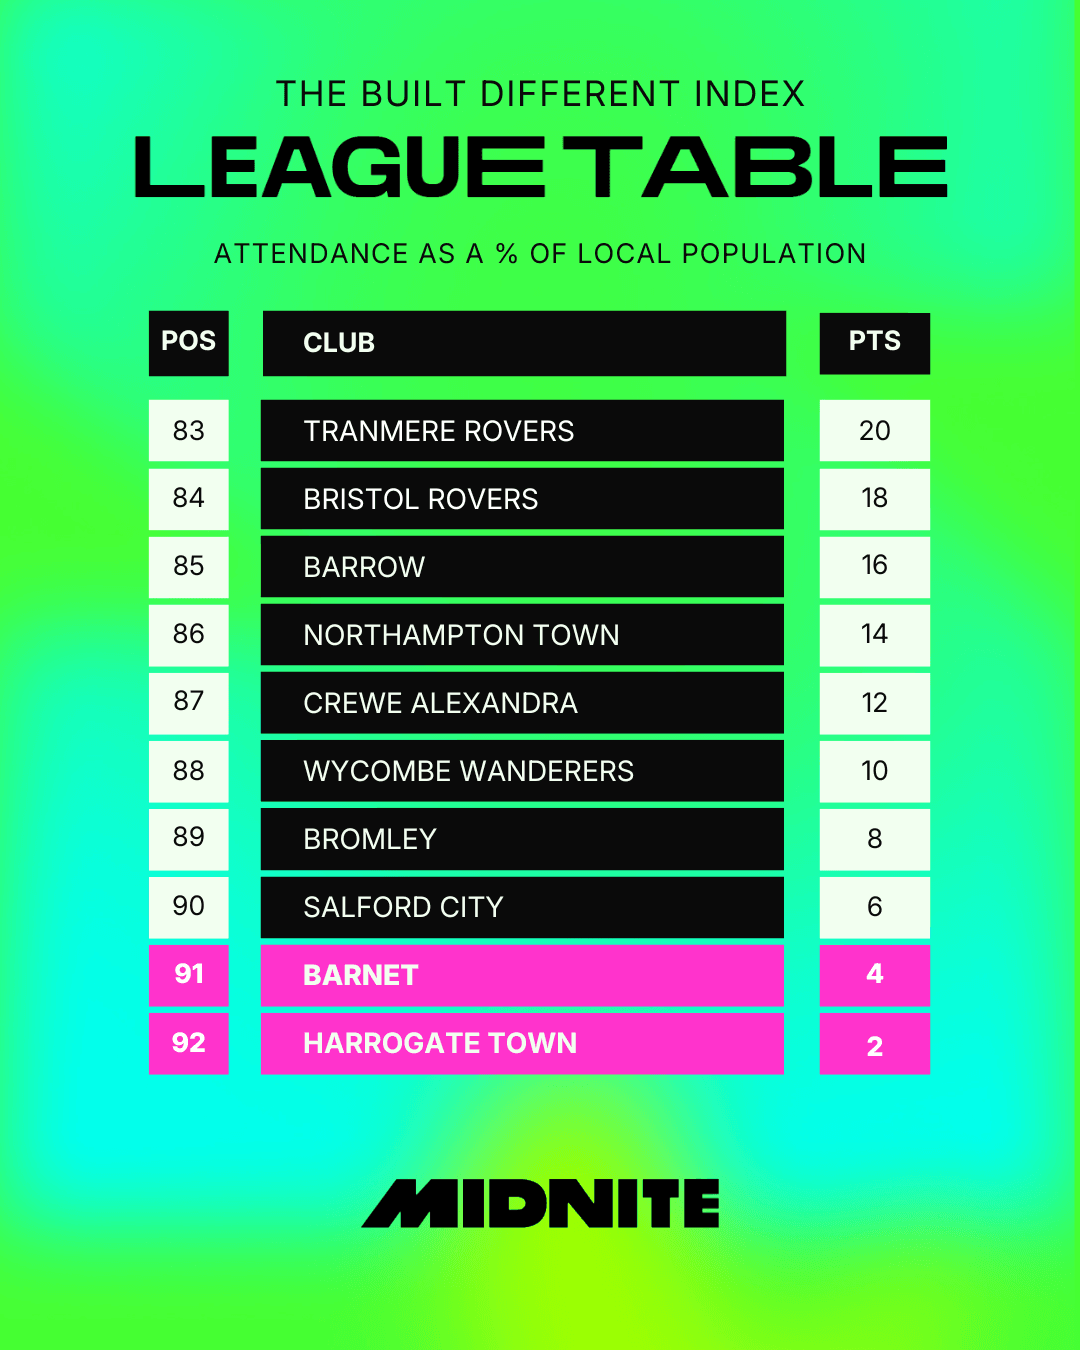
Salford City rank 90th, with an average attendance of 2,800 equal to 1.04% of Salford’s population.
That is not an empty ground, but it is a small share of a city with roughly 270,000 residents.
Salford also exist in one of the most crowded football regions in the country, where local attention is not exactly sitting around waiting to be claimed. The ratio reflects that competition, even if the table itself does not try to explain it.
Barnet hit exactly one per cent
Barnet finish 91st with 1.00%, based on an average attendance of 2,600 against the population of Harrow, listed at around 261,000.
There is something almost suspiciously neat about the number.
One per cent.
Clean. Precise. Not especially flattering.
Barnet fall 55 places from their overall ranking, partly because The Hive is being compared with a large Local Authority population rather than a small football town.
Harrogate finish bottom
At the bottom are Harrogate Town, whose average attendance of 2,800 represents just 0.46% of North Yorkshire’s population, listed at roughly 615,000.
That is the smallest ratio in the table by a clear distance.
It is also the clearest example of how much Local Authority size affects the outcome. Harrogate are measured against the whole of North Yorkshire, an enormous administrative area, so even a respectable League Two crowd barely registers as a percentage.
The club has not failed to capture Harrogate.
It has simply been handed almost an entire county as its denominator.
What the table tells us
This factor is not a definitive ranking of local loyalty, because Local Authority boundaries are rarely drawn with football arguments in mind.
What it does show is concentration.
Brighton, Manchester United and Arsenal produce crowds that are enormous relative to the areas used to measure them. Forest surge because the City Ground sits within Rushcliffe. Burnley look exactly like the football town everyone assumes they are.
At the bottom, Harrogate’s number says as much about North Yorkshire’s size as it does about Wetherby Road.
That tension is what makes the category worth having. Football clubs do not exist neatly inside census boxes, but comparing the two reveals where matchday feels biggest against the place around it.
Sometimes the whole town seems to be going.
Sometimes the Local Authority is simply far too large to notice.
The Full Table



Company
Help
Product
Support
Payment Methods


Play Responsibly
Midnite is operated by Dribble Media Limited for customers in Great Britain, licensed and regulated by the Great Britain Gambling Commission (Account No. 42647 ) and Midnite Europe Limited for customers in Ireland, licensed by the Gambling Regulatory Authority of Ireland (Licence No. GRAI-0767-RB-26-0001 ).
Dribble Media Limited is incorporated under the laws of England and Wales, with Company Registration No.09555672, and registered address at 86-90 Paul Street, London, EC2A 4NE United Kingdom. Midnite Europe Limited is incorporated under the laws of Malta, with Company Registration No.C90791, and registered address at Level 3 (suit 2327) Tower Business, Tower Street, Swatar Birkirkara BKR4013, Malta. Please play responsibly, for more information and advice visit: www.begambleaware.org or www.gamblingcare.ie


